
In this example, it is described how to cosimulate Ansys Speos-optiSLang backlight panel design optimization and its illumination distribution in relation to brightness and uniformity. One of the key features is the use of Speos 3D Texture capabilities, which was originally developed for backlight unit products and can be used to design light guides, brightness enhancement films (BEFs) and backlight unit microstructures consisting of thousands/millions to create a uniform display. The system is parameterized, various input/output metamodel combinations are created, and finally the system is optimized. The ultimate goal is to achieve the best uniform light distribution while maintaining high coupling efficiency for the highest light output. Ansys Speos and optiSLang were selected to work together.
Preface
Backlit displays are everywhere, laptop displays, smartphone displays, LCDs, etc., all of which utilize backlit displays. In any case, it is important to have a uniform illumination to achieve bright and clear images. The most common backlighting technology is LCD, and LEDs are used in backlighting systems in combination with brightness enhancement films, diffusers, and light-guiding structures. A common way to guide light is to create a texture pattern that extracts light evenly along the system. The 3DTexture feature provided by Speos allows users to virtually pattern thousands of microscopic optical elements without worrying about memory limitations. To optimize this pattern, the Texture model is parameterized in Speos and parameter sensitivity analysis is performed using optiSLang, and then the system is robustly optimized to achieve the desired results.


Operational process overview


This simulation requires 2 products:
Speos is used to model the 3DTexture dot distribution of display layers and backlight;
optiSLang is used to study parameter sensitivity and optimize design performance.
Step 1: Creation and analysis of Speos display structure
In one step, the optical and mechanical components of the display structure are defined in Speos. Some parameters will be used as input for optimization later (e.g., the density of 3D texture dots), but in this initial structure, only initial set values are given. Optical simulations are then performed to convert the quantitative outputs into optimization targets. These values indicate how the design performs in terms of light output, uniformity, manufacturability, etc.


1. Speos allows to build the scene structure based on physical optical properties, in this step, a standard simulation process is followed as shown below to obtain the visual perception that the end user will get in the final product. Note: For visualization purposes, the brightness sensor in this image is placed relatively far away from the display.


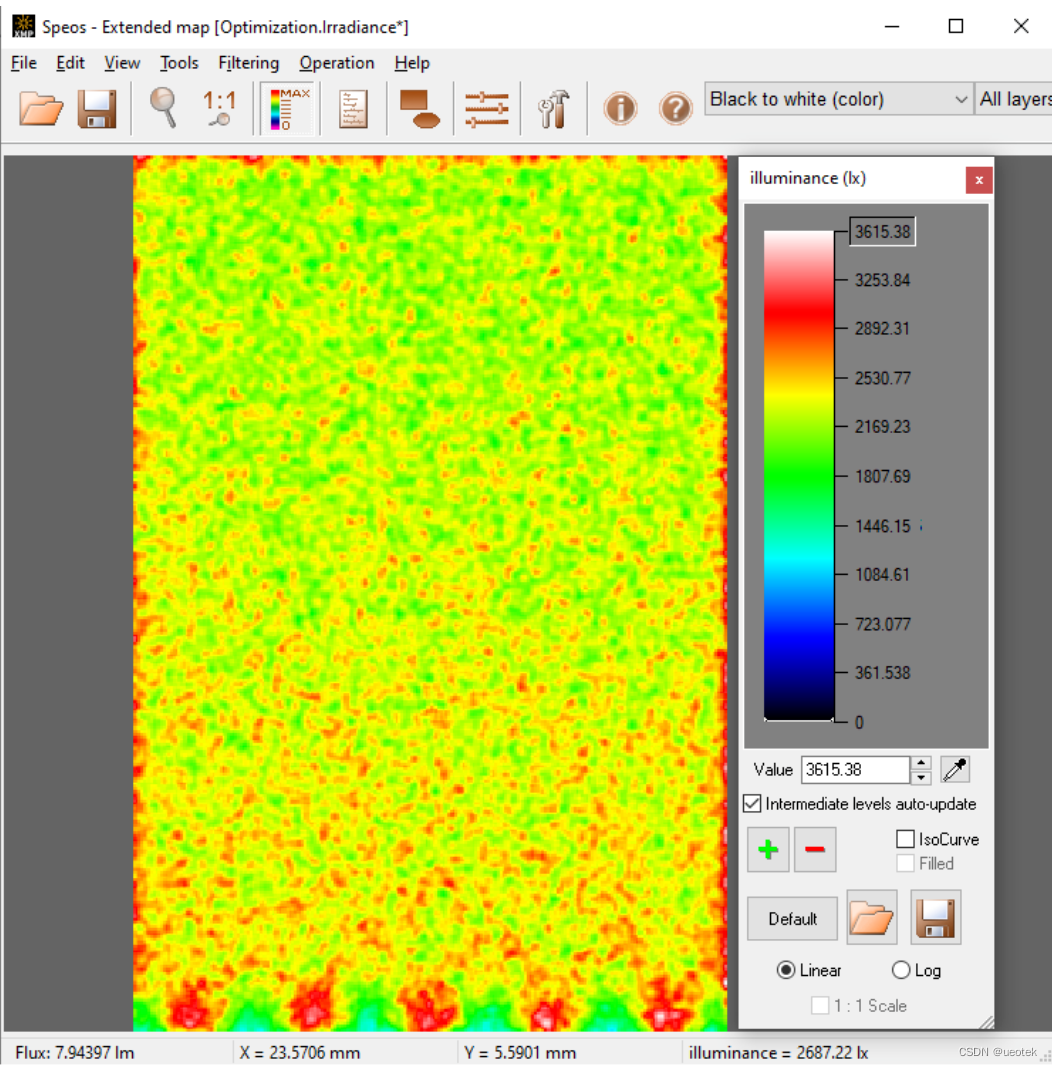
2. Illuminance simulation results The XMP results are given, and each pixel contains the illuminance information. Obviously, the initial design has poor performance in terms of total flux and uniformity (RMS contrast). Therefore, optimization is needed.
Step 2: Create Speos 3D texture light guide points
The Speos 3D Texture feature from Speos allows for the simulation of micro-textures by modeling and projecting hundreds, thousands or millions of geometric items onto geometry. Here, for example, a 3D Texture with a hemispherical pattern is applied to the back of a light guide, which is set to remove material from the base light guide. The final array of hemispheres is controlled by parameter inputs, which can ultimately be controlled by optiSLang.


Using 3DTexture in Speos reduces calculation time and file size. In this step, hundreds of hemispherical patterns are applied to the back of the light guide and are commanded to delete their volume from the backlight. The manipulation of 3DTextue parameters changes the size and density of the pattern, thus changing the light output and uniformity of the light guide.


Step 3: optiSLang sensitivity analysis
After creating the model and simulating in Speos, the optimization is set up in optiSLang. Part of this process requires a sensitivity analysis, which will identify the most critical inputs that affect the results. These identical inputs are defined at the same time as a reference value, either constant or non-constant, and within a working range. The sensitivity analysis is performed using optiSLang’s Adaptive Metamodel of Optimal Prognosis (AMOP) approach. It represents the approximate results for all possible combinations of inputs.
Here, the X and Y mapping distances, the global scale of the image, and the scale in the Z direction are taken as input, and the total flux and RMS contrast (for measuring consistency) are taken as output.


In this step, the Evolutionary Algorithm algorithm is used to search for the best design globally and locally. The optimization algorithm sampled 10,000 designs on the MOP to find the combination of input parameter values that leads to the best design. The results of the multi-objective optimization are visualized in a “Pareto chart” (see the figure below, red and black dashed line chart). The figure shows the trade-off between the two objectives, where the best design set is marked with red dots (defined as the Pareto front). The workflow automatically verifies the 20 best designs (shown as green dots) through a real solver call. Due to the good COP value, the difference between the predicted value and the verified value is small. Appropriate verification is performed throughout the optimization process, from obtaining the best trade-off (ie, the balance between flux and uniformity) to achieving the best design (ie, acceptable flux, optimal uniformity).


optiSLang determines the most suitable optimization method based on the number and type of parameters. This article uses a random search method, which mimics the processes of natural biological evolution, such as adaptation, selection, and mutation. In this case, the maximum number of samples is set to 10,000, and the optimization will be performed on the MOP, and then the best design will be verified using a real solver.


The best design parameters (input) can be verified by applying to 3DTexture and running Speos simulation.


Important parameter settings in Speos
Remove 3DTexture
The “removed” 3DTexture is set up by a “*.OPT3DMapping” file which provides the position, orientation and size of each pattern element. Sensitivity analysis and optimization create differences in this mapping file to change the texture pattern. Every time a simulation with a 3DTexture is calculated, a file with the extension “.bin” is created. It is important to let this file be written automatically at job start and not to write it manually. Otherwise the pattern will not change from one iteration to the next.
Illuminance sensor
In order to define goals in optiSLang, measurements must be created in the initial results and saved as an XML template. The same template is then imported into the sensor inside Speos. The resulting simulation results contain the measurements and are used to optimize the goal setting .
Maximum number of Surface interactions
The maximum number of surface interactions. Light guides rely on total internal reflection to guide light, resulting in many surface interactions. You may need to increase the simulation settings from the default value of 100 to 1000 or even larger.
Geometric distance tolerance
Geometric distance tolerance Since the pattern elements are microscopic, the displayed layers are thin, and the gaps between layers are small, we have to set a lower geometric distance tolerance than the default value of 0.05mm, 0.005 or even smaller.